
DATA IS LOADING...
×
The data in the file is organized in a space-delimited format. The resolution of the Global Grid is 2.5 x 2.5 degrees, whereas the Regional Grid has a resolution of 0.1 x 0.1 degrees.
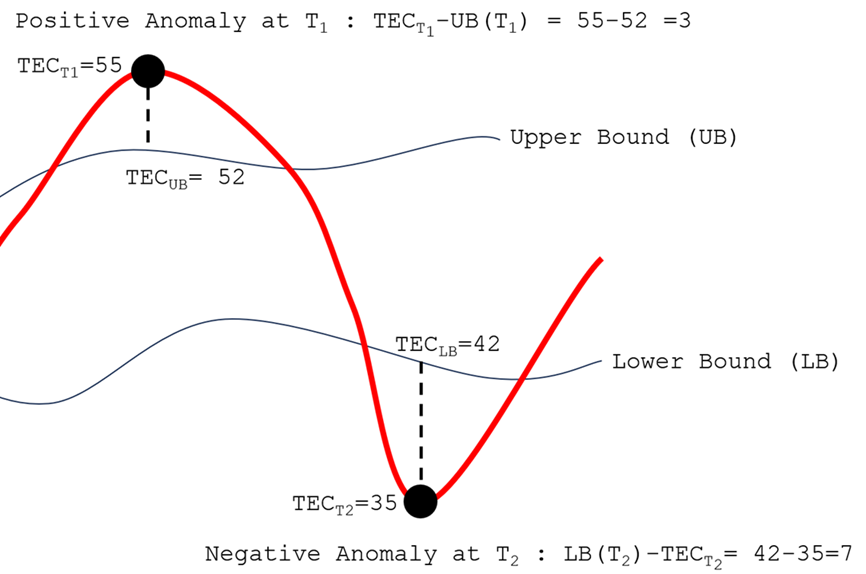
The figure illustrates the method for calculating values of positive and negative anomalies.Negative anomalies in TEC values are represented as absolute values to simplify the visualization. The file displays data that is not anomalous as 'NaN'.
Data for N/A
The anomaly maps are created using GIMs from the CODE data center:
https://cddis.nasa.gov/archive/gnss/products/ionex/
|
Positive Anomaly |
Negative Anomaly |

 OMNIWeb Data Source:
  Bx, By, Bz, Proton Density and Solar Wind Sppeed Source :
  DST Source :
  Kp and F10.7 Source :